Understanding your Discovery Mode performance report
Discovery Mode can help your songs reach more listeners and grow your fanbase. You can view your performance reports in your Campaigns tab.
Reporting metrics
We provide metrics across three categories: audience growth, long-term engagement, and streams. You can use these metrics to measure how your campaign performed overall, as well as how each individual song performed.
All metrics are updated daily starting on the 11th day of a campaign, up until the campaign end date. Long-term engagement metrics continue to update for 14 days after your campaign ends.
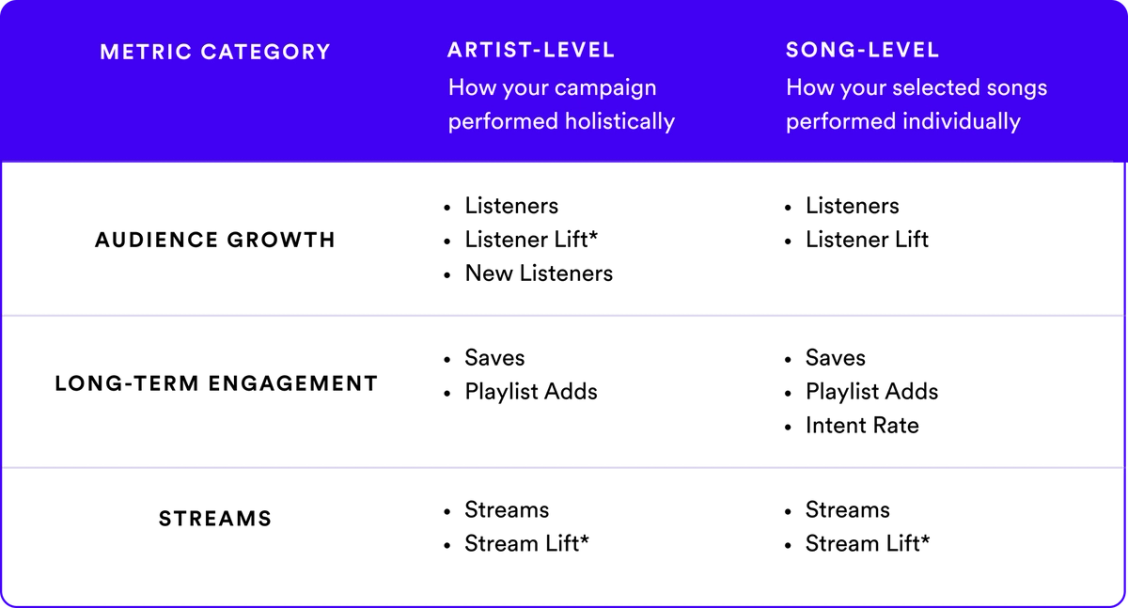
*These metrics are calculated by comparing the results of that metric during the campaign’s active period to the baseline average results of that metric during the 28 days prior to each song being selected for Discovery Mode.
Note: Discovery Mode campaign results may be impacted by other factors, including organic trends on and off platform and paired marketing efforts.
Comparing performance to before Discovery Mode
When comparing streams or listeners to a time before Discovery Mode, we use a 28-day period before a song is first selected for a campaign. The comparison period stays the same for as long as a song remains in Discovery Mode, which could be multiple campaigns in a row. It resets when you remove a song from Discovery Mode.
Your 28-day comparison period may vary depending on when you first select the song for Discovery Mode. For example:
- If you first select a song for a campaign starting March 1, the 28 days will be from February.
- For a different song that you first select for a campaign starting April 1, the 28 days will be from March.
Note: All metrics are updated daily starting on the 11th day of a campaign, up until the campaign end date.
The number of days for the comparison period is equal to the number of days the current campaign has been active.
Calculating stream and listener lift
The stream lift and listener lift metrics from your report can help you understand the performance of songs in Discovery Mode during your campaign. The report applies these metrics to individual songs and to your campaign as a whole.
Stream lift compares the percentage difference between:
- The average daily streams of your selected songs in Discovery Mode contexts over the 28 days before those songs were first selected for Discovery Mode, and
- The average daily streams of your selected songs in Discovery Mode contexts during your current Discovery Mode campaign period.
Listener lift compares the percentage difference between:
- The average daily unique listeners of your selected songs in Discovery Mode contexts over the 28 days before those songs were first selected for Discovery Mode, and
- The average daily unique listeners in Discovery Mode contexts during your current Discovery Mode campaign period.
Learn more about Discovery Mode contexts
Understanding your performance report
You can use your performance report to choose which songs to select for future campaigns. There are several key metrics within each category you may want to consider when assessing the performance of individual songs:
- For audience growth, consider listeners and listener lift. These metrics can convey the song’s impact on your campaign’s overall performance.
- For long-term engagement, consider saves and playlist adds. These actions represent a high intent from listeners to play the song again.
- For streams, consider stream lift. This percentage shows how the song's average daily number of streams in Discovery Mode contexts has changed since the 28 days before the campaign began.
We encourage you to prioritize the metrics that are most aligned with your marketing strategies and campaign objectives to determine the success of your campaign.
Need more help?
Learn more about how Discovery Mode works and how artists are using it for their new release strategy and to grow their audience.
Get in touch through our contact page.